Synopsis
Grafana is an open-source analytics platform for visualizing and analyzing data from a wide range of data sources. Checkmk, a monitoring platform for the IT infrastructure, can be connected to Grafana - it allows the administrator to easily visualize the data, analyze past system behavior and predict future trends.
While checkmk provides its own way of plotting data, one might want to integrate it with Grafana to achieve uniformity of the IT monitoring infrastructure and obtain additional analysis tools for their storage system.
Open-E JovianDSS allows for a container-based deployment of checkmk without any additional requirement for hardware or licenses in the form of a Small Update. This robust monitoring tool can be integrated with Grafana software by following the steps presented in this article.
Prerequisites
To successfully integrate checkmk deployed n a Open-E JovianDSS container with Grafana you will need:
- deployed Grafana on a separate server (virtual or physical)
- Open-E JovianDSS storage (current main release: up30)
- checkmk Small Update deployed as a container in Open-E JovianDSS (current version of checkmk: 2.1.0p12)
Installation of checkmk Small Update
Small Update installation is a simple procedure:
- go to System Settings > Update and click “Upload”
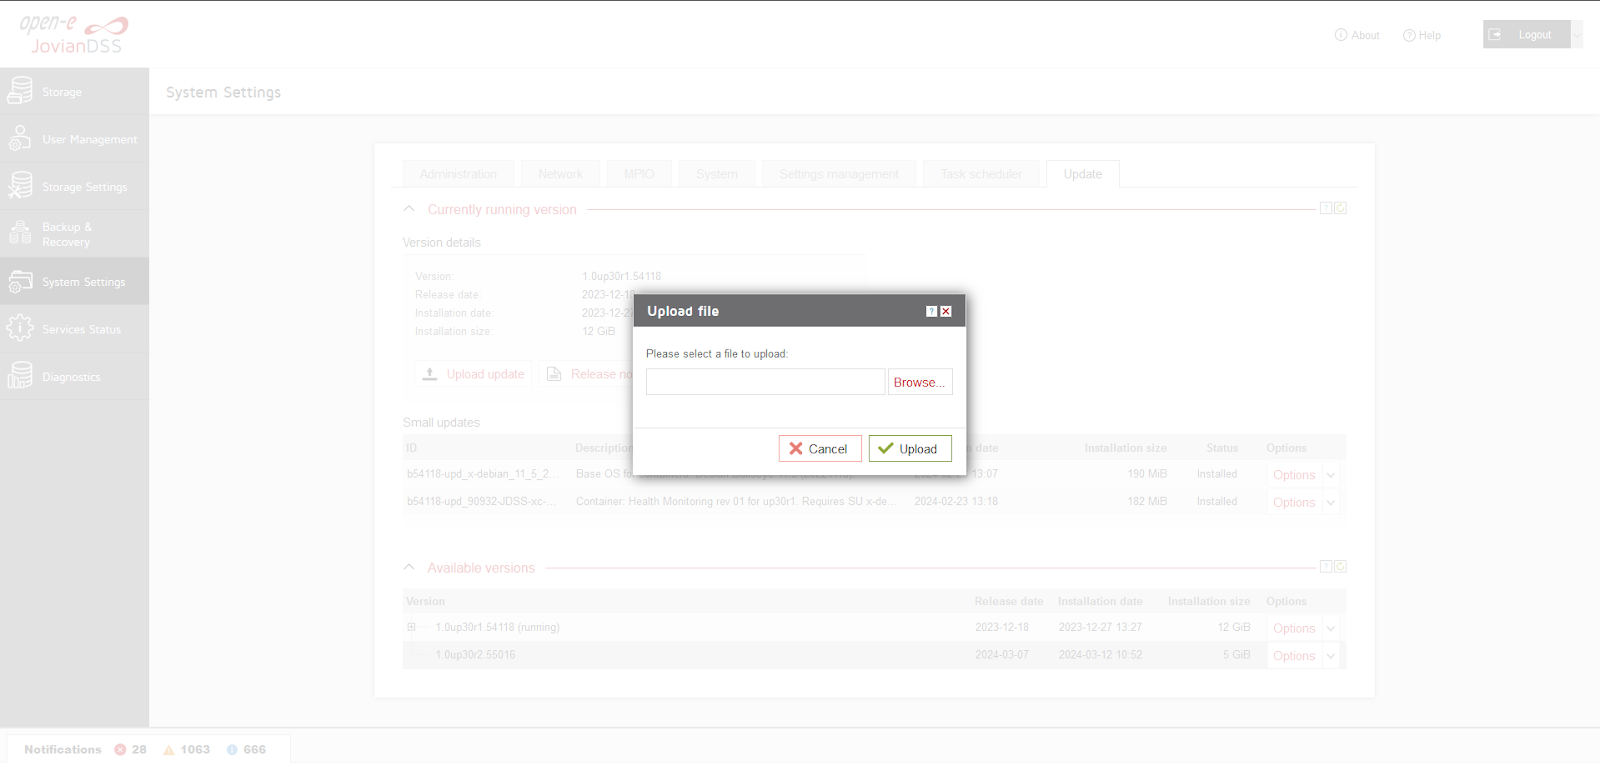
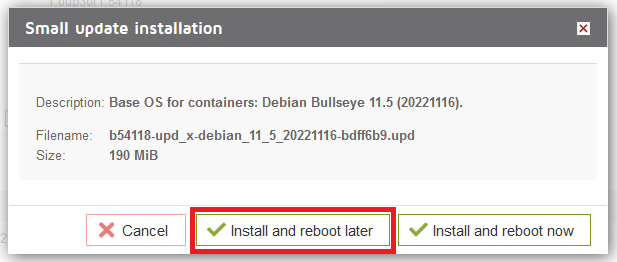
- choose a required file and click “Install and reboot later”
- upload more Small updates if necessary
- reboot the Open-E JovianDSS server
The current version of checkmk container requires 2 Small Updates to work properly: the checkmk container and the package of repositories.
Only one reboot is necessary once all the Small Updates are installed to finish the procedure. The order of Small Update upload does not matter.
Installation of Grafana
Grafana can be installed on Linux, MacOS or Windows machines depending on the requirements of the infrastructure. Please follow the guide from the official Grafana page (https://grafana.com/docs/grafana/latest/setup-grafana/installation/).
During our testing, we deployed Grafana on the latest LTS version of Ubuntu, Ubuntu 22.04.4 LTS.
Grafana and checkmk integration
The integration of Grafana and checkmk is described in the following article by checkmk - https://docs.checkmk.com/latest/en/grafana.html. This article is written for a standalone version of checkmk and for the latest stable version (2.2.0). To adjust it to our ecosystem it is required to make some changes to the procedure.
- As the version of checkmk deployed in a container under Open-E JovianDSS is 2.1.0, it is required to do a preliminary step and check the prerequisites in checkmk - this step is described well in the following article by checkmk: https://docs.checkmk.com/2.1.0/en/grafana.html in point 2.
- After this preliminary step is done, follow points 2 and 3 from the latest integration article. Take note which version of Grafana you are using, create a suitable checkmk user and remember to allow unsigned plug-ins in the grafana configuration file (described in the point 2.3 of the manual).
NOTE: In addition to the roles assigned to the user described in the manual, it is important to add “Use WATO'' in addition to “User management” role under “Setup” in checkmk. If this role is omitted, during the Grafana authorization you will be prompted with the following error:
Authorization Error. Insufficient permissions for 'We are sorry, but you lack the permission for this operation. If you do not like this then please ask your administrator to provide you with the following permission: '<b>Use WATO</b>'.'
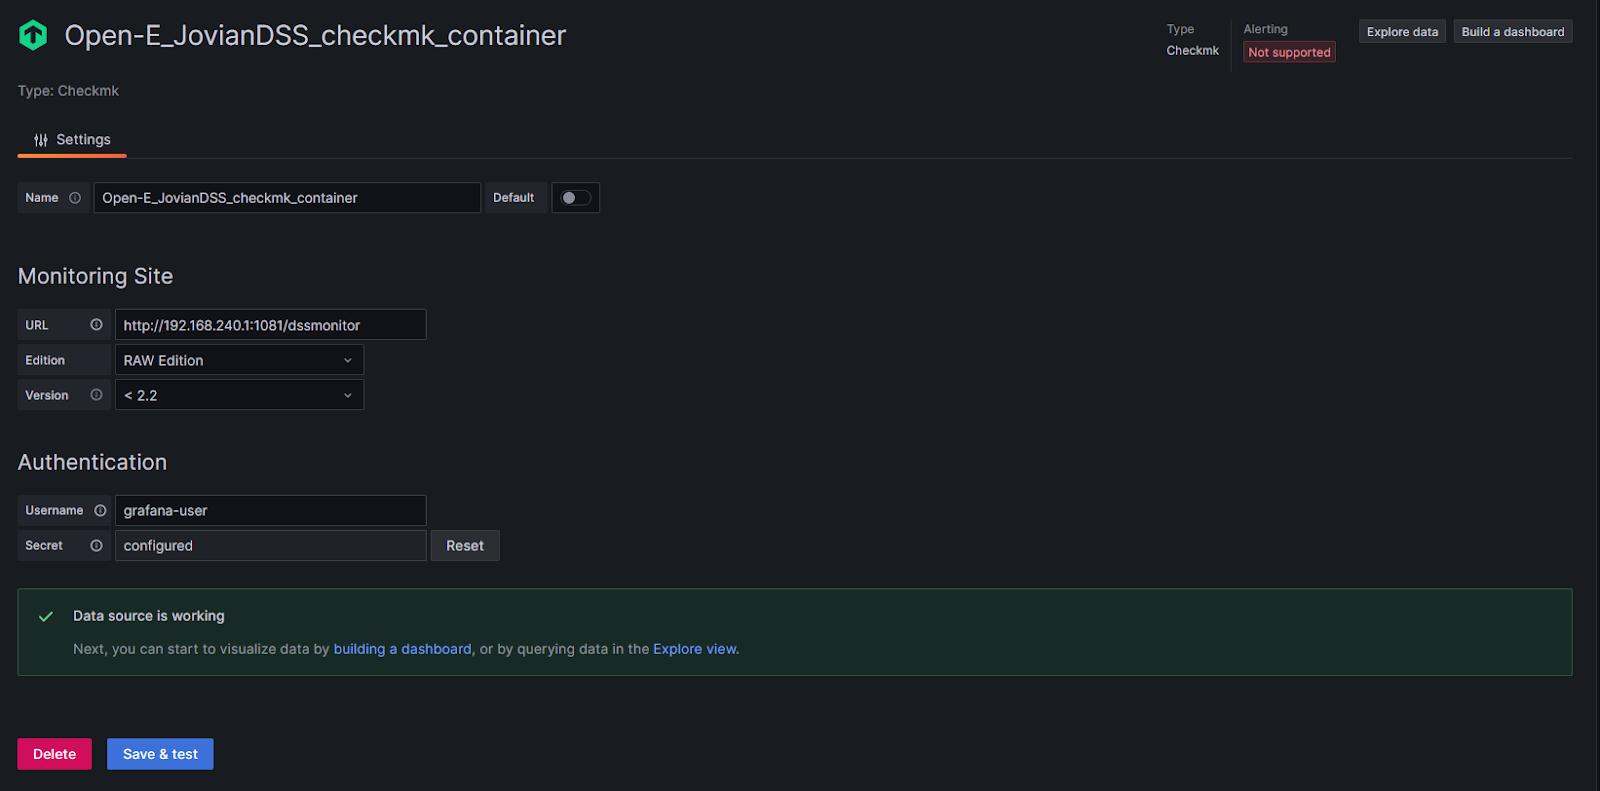
To communicate with the data source, Grafana requires the user to provide the URL for the WebGUI of checkmk. In the case of container-deployed checkmk in Open-E JovianDSS, the URL will be:
https://<JOVIAN_MANAGEMENT_IP_ADDRESS>:4080/dssmonitor

e.g. https://192.168.240.1:4080/dssmonitor
using this exact URL will result in an error while connecting to the Grafana. As our checkmk deployment uses a self-signed certificate, it is necessary to add an HTTP port as a way to access the WebGUI.
This can be done via the console access of checkmk container:
- The console is accessible under port 4200. Use this URL:
https://<JOVIAN_MANAGEMENT_IP_ADDRESS>:4200/checkmk
to access the console.
default login: admin
default password: admin
use the default login and password provided in the README file of the Small Update if they were not changed beforehand
- edit the file /etc/apache2/ports.conf with your favorite text editor (e.g. mcedit or vim):
sudo vim /etc/apache2/ports.conf
The point is to add an additional port for the Apache service to listen on.
Do not modify the line:
Listen 127.0.0.1:1080
As this line allows the access to the GUI via https port.
Add a line under it, the syntax is as follows:
Listen PORT
For the sake of the example, we will use port 1081:
Listen 1081
You can use any free port in your network. If you want to isolate this HTTP connection from other clients you can configure proper rules in your network.
- save the changes and restart the apache2 service:
sudo systemctl restart apache2
after the service is restarted you checkmk WebGUI should be accessible from the client machine under the following link:
http://<JOVIAN_MANAGEMENT_IP_ADDRESS>:1081/dssmonitor
Once all is done, jump to point 4 of the manual. If everything was done correctly you will be able to configure working checkmk data source: